
This article is a step-by-step guide to building a real-time data pipeline for a virtual online store(which we will create too) to perform analytics on it later.
It is fascinating to see how malleable our data is becoming. Nowadays we have tools to convert highly nested and complex log data to simple rows format, tools to store and process petabytes of transaction data, and tools to capture raw data as soon as it gets generated, to process and provide useful insights from it.
In this article, I would like to share one such step-by-step process of generating, ingesting, processing, and finally utilizing real-time data from our own virtual online store.
Prerequisite
1. Google Cloud Platform account (If you don’t have an account sign up here for a 3-month free trial with $300 credit to use).
2. Linux OS.
3. Python 3.
Architecture

Step1: Create Pub/Sub Topic and Subscriber
Pub/Sub is a messaging service available in the Google Cloud Platform. It can be considered as a managed version of Apache Kafka or Rabbitmq.
A messaging service basically de-couples the system which produces data(virtual store application in our case) from the system which processes the data(Apache beam on Dataflow in our case). First, we need to create a service account in GCP which will allow us to access Pub/Sub from our application and Apache beam.
Login in to your GCP console and select the IAM & Admin from the left menu:

Select the Service Accounts option and create a new service account:

Provide the Pub/Sub Admin role to our service account:

And finally, Create a key and download the private key JSON file for later use:

Next, we will create a topic in Pub/Sub to publish our virtual store data into it and a subscriber to pull data from it using Apache Beam.
Select Pub/Sub from the left menu of the GCP console.

Select Topics from the sub-menu. From the top, select CREATE TOPIC. Enter a suitable name and click CREATE TOPIC.

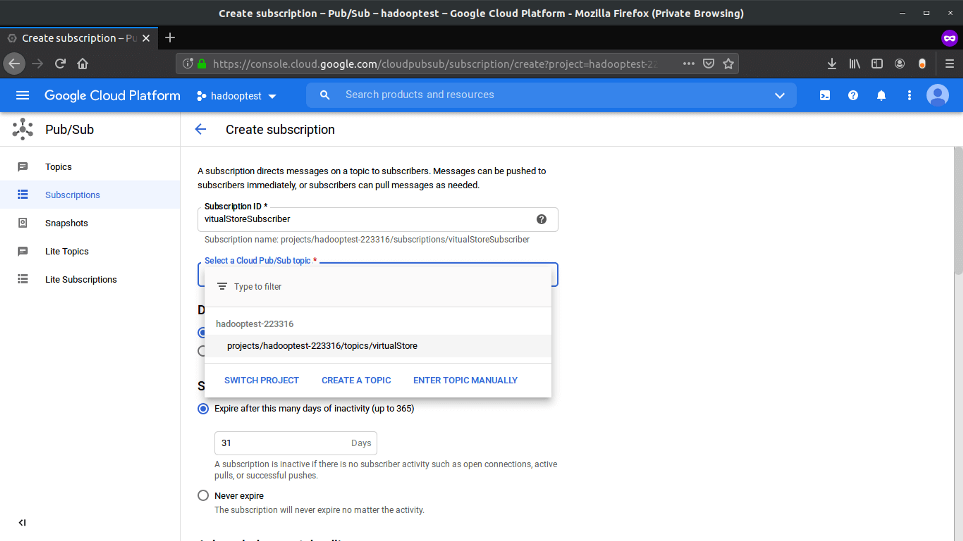
Now, select the Subscriptions option from the left and from the top, select CREATE SUBSCRIPTION. Enter a suitable name, select the topic from the drop-down (we created in the previous step) to which the subscriber will listen for the stream of data. After that click Create at the end, keeping other options as it is.
Step 2: Create A Virtual Store For Generating Realtime Data
Now we will create a virtual online store that will push the transaction data into the pub/sub Topic that we have created in previous steps.
I have used Dash which is a tool created by Plotly to quickly build a web application using different prebuild UI components like buttons, text input, etc. A complete tutorial to build a web application is out of this article’s scope since our main focus is to build a real-time pipeline. So you can just download the complete application from the GitHub repo Here.
The only thing important is the script that publishes our data into the Pub/Sub topic:
Let’s start our online virtual store, after downloading the project from Git repository create a virtual python environment and install all the packages using the requirement.txt file. Now open the folder in the terminal and run app.py file. You will see the below output:

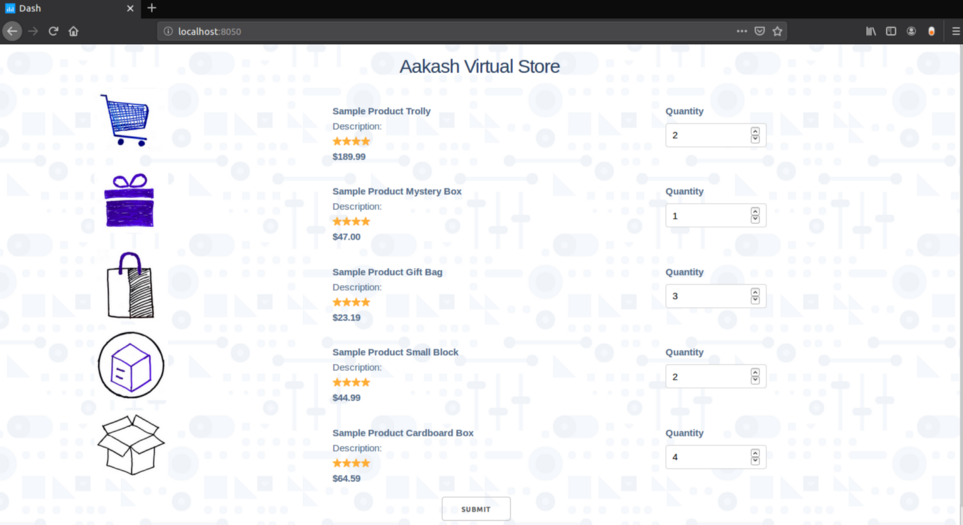
Go to your web browser and open localhost:8085. You will see the virtual store home page.

Now the fun part let’s order a few items and see how our data is getting published into the pub/sub topic and then pulled by the subscriber, that we have created earlier. Add some quantity for each item and click Submit:
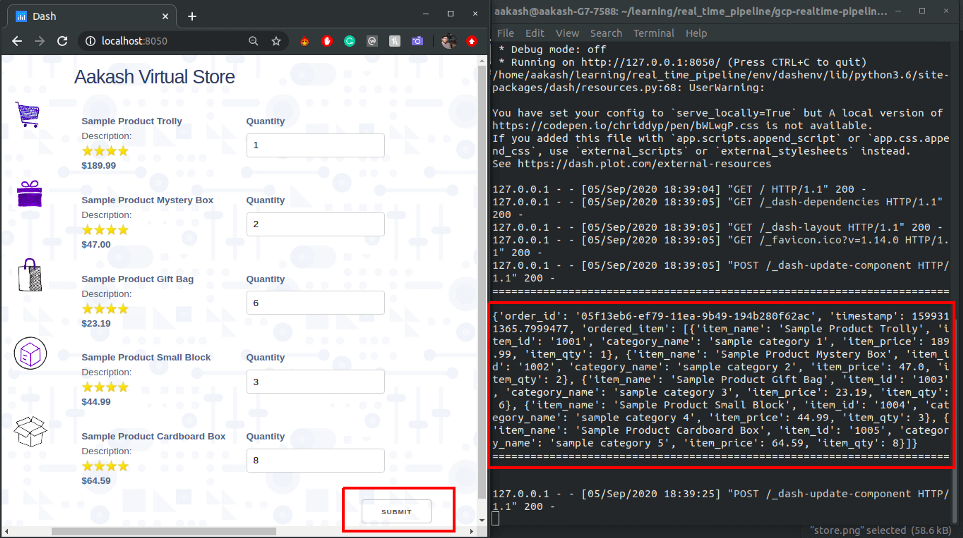
You can see in the terminal some transaction data in JSON format is getting printed every time you place an order. Same JSON data is pushed to the Pub/Sub Topic also. Let’s pull the data from our subscriber, go to the pub/sub dashboard in GCP select the Subscriptions option from the left menu after that click on VIEW MESSAGES from the top and then click Pull to see the published data:

Step 3: Create Apache Beam Pipeline And Run It On Dataflow
At this stage, we are getting the data in real-time from our virtual online store to our Pub/Sub subscriber. Now we are going to write our pipeline in Apache Beam to unnest the data and convert it into a row-like format to store it in MySQL server. And finally, we will run our pipeline using GCP Dataflow runner.
Before we start writing our data pipeline let’s create a cloud SQL instance in GCP which will be our final destination to store processed data, you can use other cloud SQL services as well, I have written my pipeline for the MySQL server.
From the GCP console, select the SQL option from the left menu:

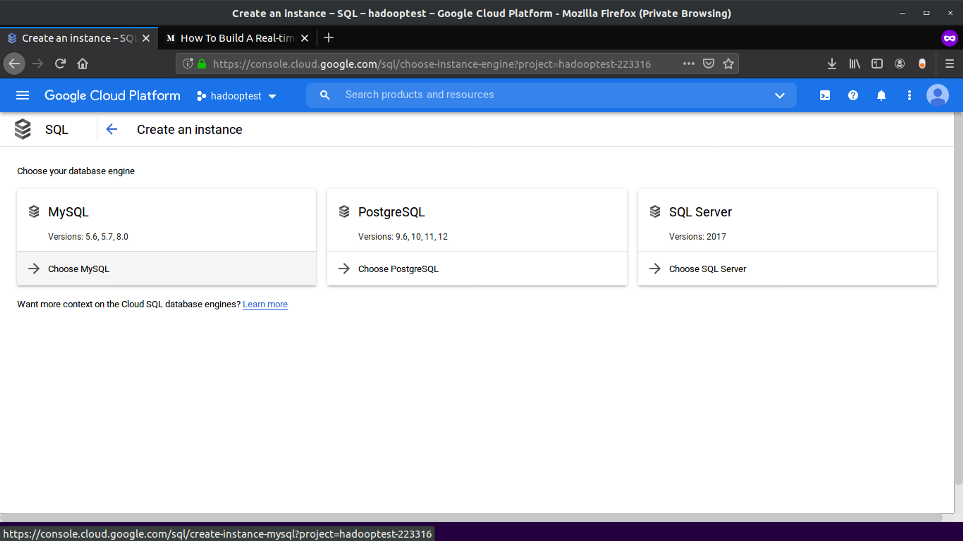
Select CREATE INSTANCE:

Select MySQL:
Enter Instance Name and Password for the root user, leave other settings to default and click Create, Now sit back and relax it will take 5–10 min to start the instance:

After the DB is up and running we need to create a database and table. Connect with your MySQL instance using any SQL client and run the below queries:
CREATE DATABASE virtual_store;

CREATE TABLE transaction_data(
`id` int(11) NOT NULL AUTO_INCREMENT,
`order_id` VARCHAR(255),
`timestamp` INT(11),
`item_id` VARCHAR(255),
`item_name` VARCHAR(255),
`category_name` VARCHAR(255),
`item_price` FLOAT,
`item_qty` INT,
PRIMARY KEY(`id`)
);
Till now have created our source (Pub/Sub Subscriber ) and Sink (MySQL), now we will create our data pipeline.
Representation of the directory for our pipeline is given below, you can clone the complete directory from my GitHub repo here:
├── dataflow_pipeline
│   ├── mainPipeline.py
│   ├── pipeline_config.py
│   ├── requirement.txt
│   └── setup.py
Let’s start first with the configuration file pipeline_config.py ,this file contains all the configurations like Pub/Sub subscriber details, service account key path, MySQL DB connection details, and table details.
Next is the main pipeline file, mainPipeline.py, this is the entry point for different runners (local, Dataflow, etc) for running the pipeline. In this pipeline script, we are reading data from the Pub/Sub, unnesting the data, and storing the final data in a relational database. Later we will visualize it using Google Data studio. Let’s look at the code:
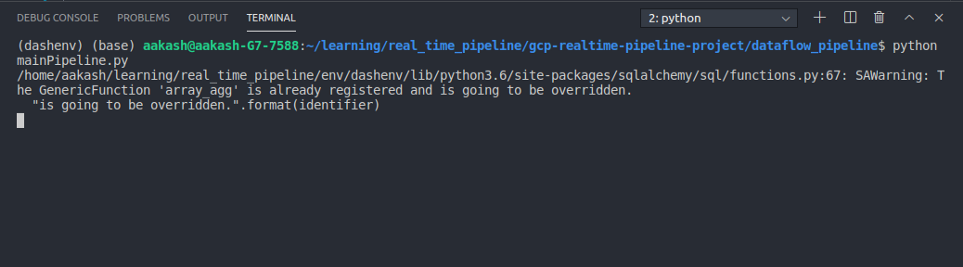
First, let’s run our pipeline locally:
$python mainPipeline.py
You will see the below output, this means our pipeline is now listening to Pub/Sub for incoming data.
Let’s place some orders from our virtual online store and see the output of the pipeline.
After clicking submit you will immediately see the output in the pipeline terminal:

As you can see our input was nested data in which all the items are nested in a single object, but our pipeline unnested the data into row level.
Let’s check our database table:
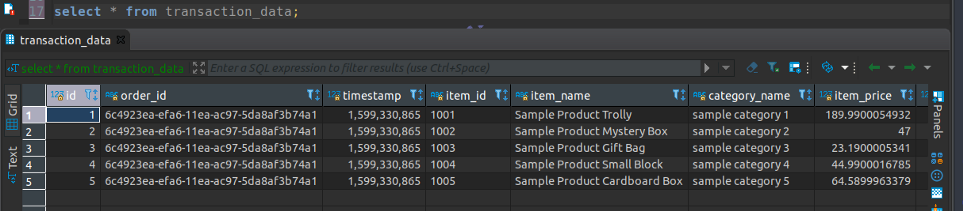
As expected our single order is transformed into item-wise row-level data and inserted in our database on the fly, in real-time.
Now we will run our pipeline in GCP Dataflow, for this, we need to run the below command:
$python mainPipeline.py --runner DataflowRunner \
--project hadooptest-223316 \
--temp_location gs://dataflow-stag-bucket/ \
--requirements_file requirement.txt \
--setup_file ./setup.py
Make sure you create a staging bucket in GCP as I did and provide the link in the above command under “temp_location” option and also create a setup.py in your directory with the below content, this will prevent ModuleNotFoundError.
Sit back and relax it will take 5–10 min to start the pipeline in GCP dataflow. Now go to the GCP Dataflow dashboard to check if the server started or not.
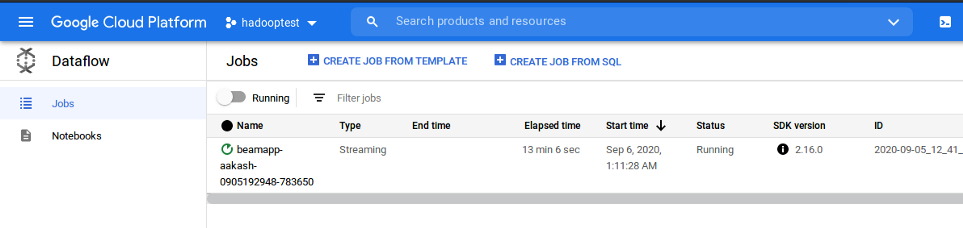
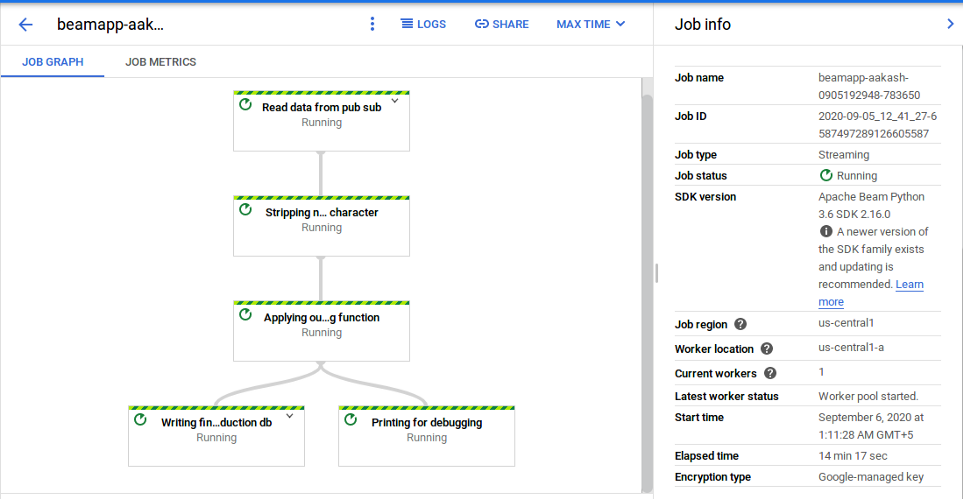
You can also see the different stages of the pipeline, click on the running job to see the details.
Place some orders from the virtual store and test if the data is coming in DB or not. In my case, it is working as expected. Rows of data in MySQL table is getting inserted in real-time:

Note: Closing our local terminal from which we deployed the pipeline in GCP won’t affect the pipeline running in Dataflow on GCP. Make sure to terminate the pipeline from the GCP as well.
Step 4: Create Datastudio Dashboard For Visualizing Our Realtime Data
Google Data Studio is a free tool for visualizing data. It enables users to create an interactive and effective reporting dashboard very quickly from different data sources.
Let’s connect our sink (MySQL server) to the Data Studio and create a dashboard on top of our real-time data.
Go to https://datastudio.google.com. Click on Create and select Data source.

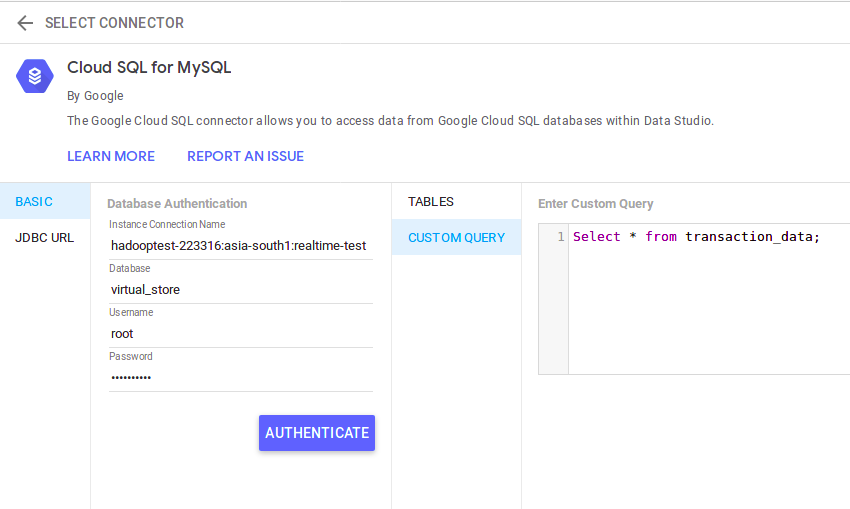
Give a name to your source at the top left corner and select Cloud SQL for MYSQL as source (If your MySQL database is not in GCP select only MySQL)

Enter your DB credentials and click Authenticate. After that select CUSTOM QUERY, enter the query and select Connect at the top right corner.
Data Studio will connect to the cloud SQL instance and show us the schema of our table. Now click on CREATE REPORT at the top right corner:

Add charts and graphs as per your requirements. You can learn more about data studio here:

I have created a basic, 2 chart dashboard which shows Item wise quantity sold and Item wise sales.
My final Dashboard, which gets updated as soon as the orders are getting placed:

Conclusion
In this article, I explained how a real-time pipeline works. We have created all the components of a data pipeline, a source application that generates data in real-time, a buffer that ingests the data, an actual pipeline in Google cloud Platform which processes the data, a sink to store the processed data, and finally a dashboard to visualize our final data.
Please leave your comment about this article below and in case you are facing issues in any of the steps specified above you can reach out to me through Instagram and LinkedIn.
It helped me a lot in my current work. Hope to see lot of posts on gcp.
Thanks!